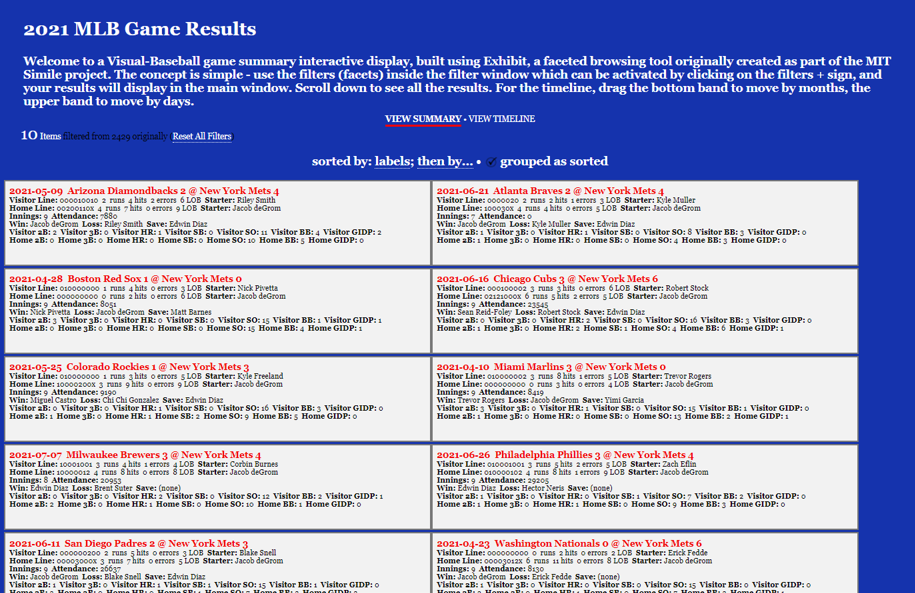
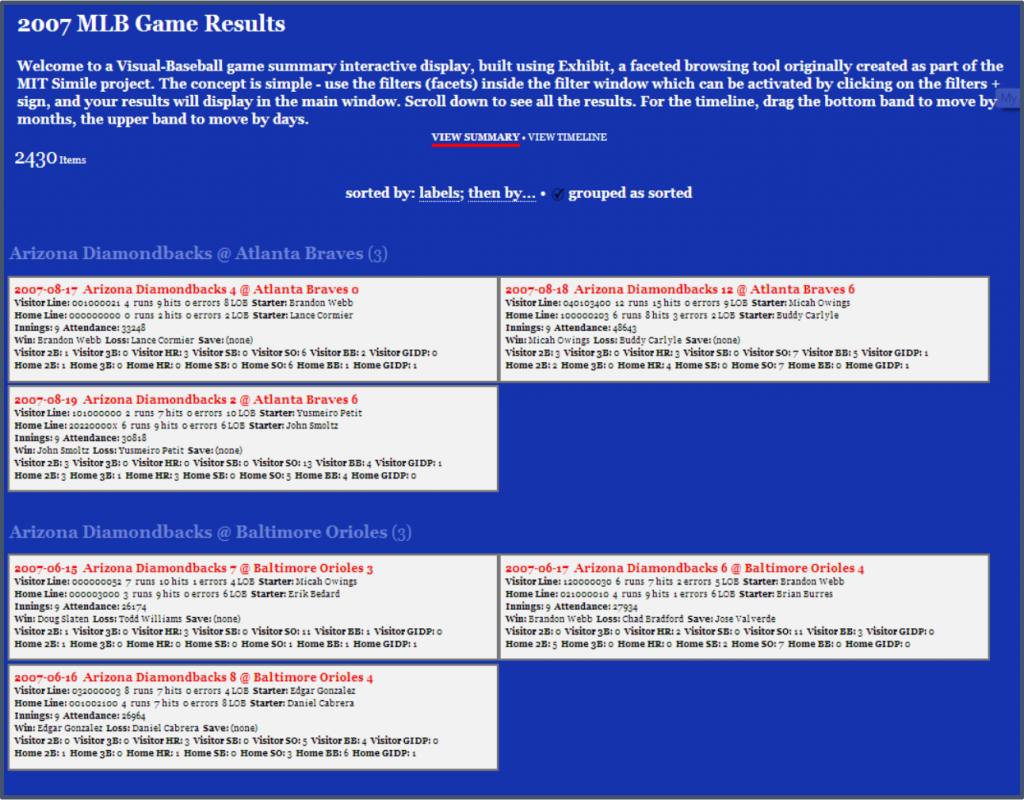
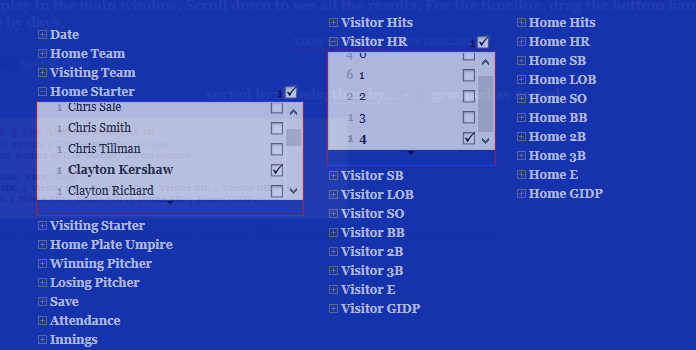
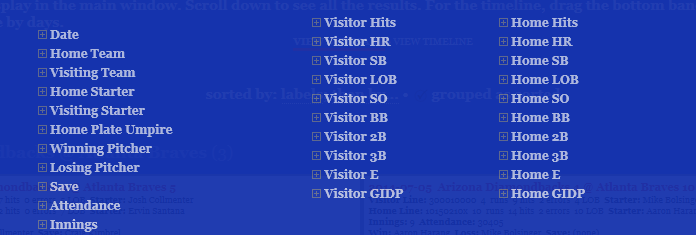
Category: Game Summaries

Retrosheet 2022 Data is Here!

One of the primary source data sets I use to create baseball visualizations is the amazingly detailed information captured by the Retrosheet project, a dedicated group of volunteers providing play-by-play and game level information for each MLB season. They have recently passed the 100-year milestone, with data from the 1921 & 1922 seasons now available. I have some catching up to do on the older seasons, but just downloaded the 2022 season for adding to my databases.

The data comes in two distinct sets – game logs being the much easier of the two to work with, due to the smaller data size. Each game played in a season is captured at a summary level (~ 2,400 records), with information pertaining to the score, players, umpires, attendance, and much more. This information is used to feed my game summary visualizations:

2007 Game Summary results

As you can see, these are bite-sized summaries of every game, showing some of the important summary data for a game. They can be filtered to find specific teams, pitchers, scores, and much more. These visualizations are currently available covering the 1955-2019 seasons; one of my immediate goals is to add the 2020, 2021, and 2022 seasons, before starting to work in reverse with pre-1955 campaigns.

Fortunately, I have lots of SQL code built up over the years to make the data update process fairly simple; the 2022 game logs have already been added, and now I’ll get to work on the play-by-play data. Stay tuned for updates, and thanks for reading!

2019 Game Summaries Are Here!

I’m happy to note that the 2019 Game Summary visualization is now complete. This is season 65 in our series of summaries (1955-2019), providing line scores for every game played during the 2019 season. You can filter by starting pitchers, teams, dates, umpires, and much more.

Here’s a screenshot from the 2007 season:

So while you’re waiting for the 2020 season to get underway, check these out to fill your baseball fix – Game Summaries

2018 Game Summaries Complete

The 2018 game summaries have been updated, using data from the Retrosheet project. This is the latest update in a series that goes all the way back to 1954. As a user, you have the ability to filter on a wide array of fields, as seen below:

The summaries provide basic data about every individual game played in a selected season – the line score, winning and losing pitchers, home runs, and much more. Here’s an example:

To have a go at the 2018 summaries, or any other season, go to the Game Summaries page in the portfolio section of this site.

2018 Game Summary Updates Begin

I’m pleased to announce that the 2018 Retrosheet game log files have been uploaded to the VBP database. This data can be used to create analysis at the game level, with a wide array of data elements, including the following:

  • Scores
  • Attendance
  • Umpires
  • Winning pitcher
  • Losing pitcher
  • Home runs
  • …and much more

This data provides the input for the Game Explorer visualizations on this site, which will be updated shortly to include the 2018 season. If you haven’t seen them previously, the Game Explorers allow users to filter across many data attributes to retrieve specific results. Here’s a screenshot:

The next step is to create the 2018 version of the explorers, adding to the existing files covering the 1955-2017 seasons. I’ll keep you posted as soon as 2018 is available on the site. Thanks for reading!

Baseball Game Summaries Updated!

Thanks to some unusually cold and rainy weather, I’ve been able to focus on updating both my source databases as well as some of the visualizations built from the data. That’s a roundabout way of saying that the baseball Game Summary exhibits have been updated for both the 2016 & 2017 seasons. They can be found in the portfolio section of the site by following this link.

As a refresher, the baseball game summaries give you a sort of visual box score for every game played in a season, featuring the line score for the game, winning and losing pitchers, attendance, and much more information pertaining to each specific game. The real power comes from the ability to filter results to find all games that match specific criteria.

game_summary_filter_1

As you can see, there are many available filter options, right down to who the home plate umpire is for every game.

Here’s a quick illustration of how the filters can be used. We’ll filter 2017 results where Clayton Kershaw was the starting pitcher at home, and gave up 4 home runs (a very rare event!). First, we select Kershaw as the Home Starter, and then we open the Visitor HR filter, and select 4 (there’s just one instance). We can then apply these filters to see at which game this unusual event took place.

Kershaw_4HR

Closing the filter window, we see the single game box score returned by our filters:

Kershaw_4HR_game

Ironically, we can see that the Dodgers not only won this game, with Kershaw as the winning pitcher, but that they too hit 4 home runs (Home HR in the box score). We can also see that the Mets struck out 13 times (Visitor SO) and the Dodgers 12 times (Home SO). Must have been a wild day at Dodger Stadium on June 19th for the 43,266 in attendance!

As you can see, a lot of information can be gleaned using just a couple of selections to filter the data. There are nearly endless possibilities for using the filters to return the information that most interests you. So have a look at the game summaries and any other items in the portfolio section. Enjoy, and thanks for reading!