In Part 1 of this series, we looked at how to generate node and edge data for all players within a single franchise’s history. Part 2 examined how we could take that data and create a network using Gephi, adding graph statistical measures along the way. In this, the final part of the series, our focus is on moving the graph beyond Gephi and on to the web, where users can interact with the data and interrogate the player network using sigma.js software. So let’s pick up with the process of moving the network from Gephi to sigma.js.
Recall our basic network structure in Gephi, which looks like this:

One of our goals when we export the graph to the web is to enable user interaction, so the above graph becomes a bit less intimidating. As a reminder, this is at most a moderate sized network; the need to provide interactive capabilities becomes even greater for large networks.
There are a few ways we can create files suitable for web deployment using Gephi. In this case, the choice is to use the simple sigma.js export plugin located at File > Export > Sigma.js template. Selecting this option will provide a set of options similar to this:
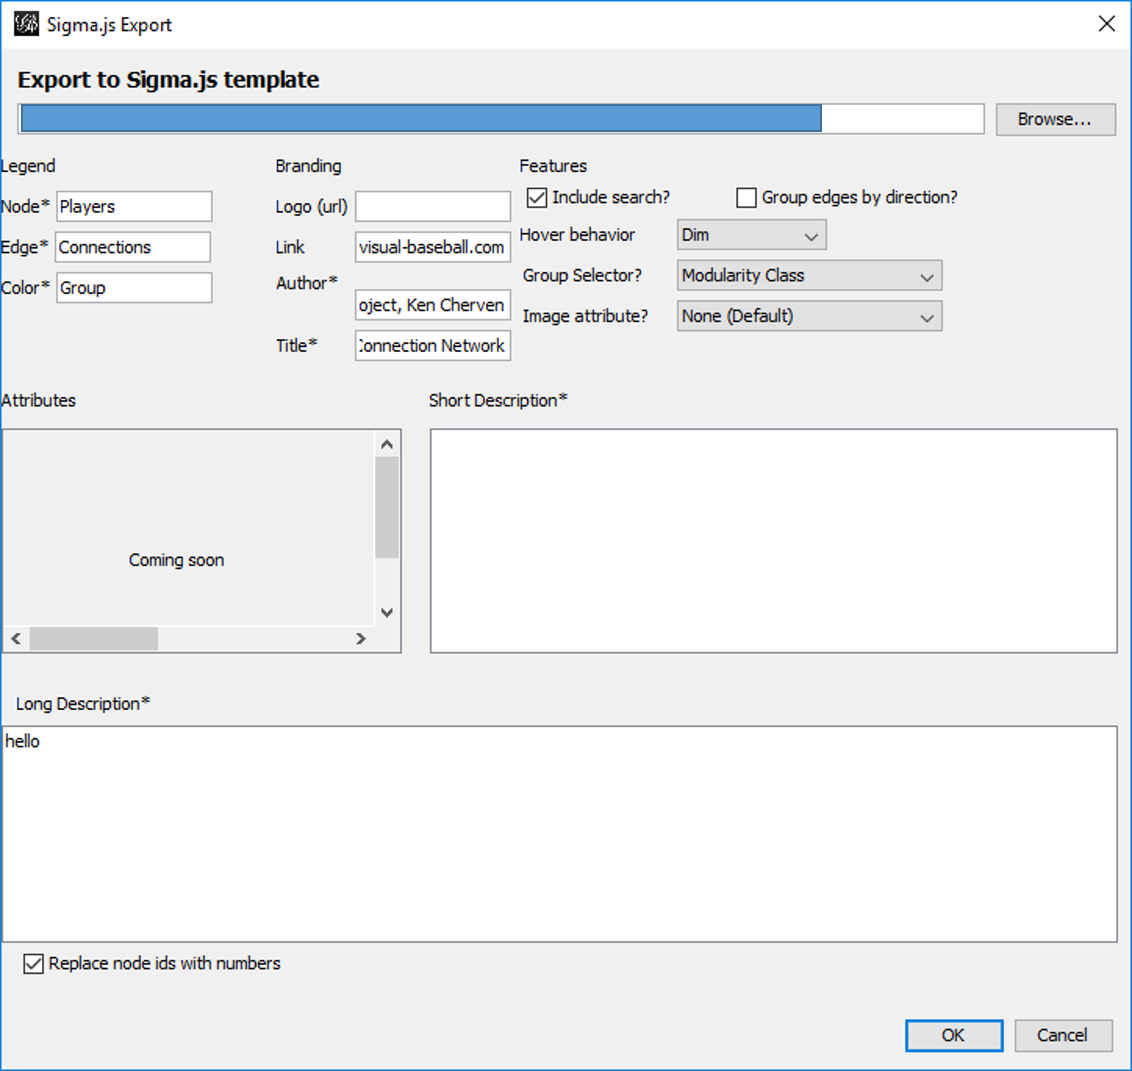
This template allows for a modest level of customization, including network descriptions, titles, author info, and other attributes relevant to the network. When all fields are filled to your satisfaction, click on the OK button to save the template. Your network will be saved to the location specified in the blank space at the top of the template window (grayed out in this case). A word of caution is in order here – if you make some custom entries to the template, and then make adjustments to your network, be sure to specify a new location to save the generated files. Otherwise, the initial set will be overwritten. This is especially critical if you have gone behind the scenes to customize colors, fonts, and other display attributes. More on that capability in a moment.
Once the template is complete and the OK button is clicked, a set of folders and files is generated that can then easily be copied to the web. Here’s a view of the created file structure:
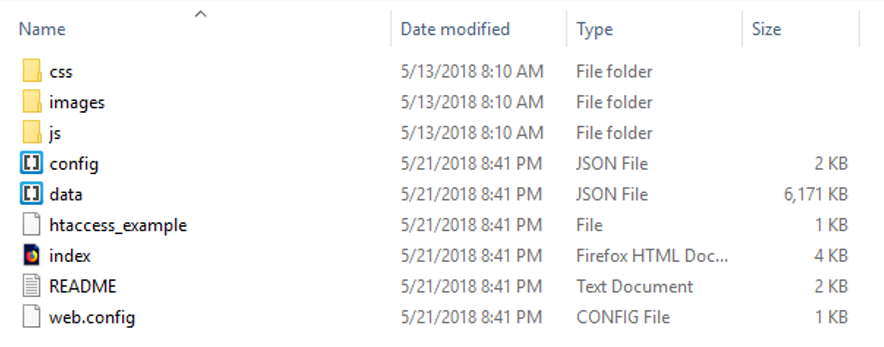
These files and sub-folders are all housed within a single folder named ‘network’. If you wish to tinker with your graph in Gephi, rename the network folder to something else prior to exporting a second (or 3rd or 4th time). This will help keep you sane. 🙂
Without going into great detail here, let’s talk about the key files:
- data.json stores all of your graph data, including positioning attributes, statistics created in Gephi, plus node and edge details
- config.json contains many of the primary graph settings that can be easily edited for optimal web display. It’s quite easy to go through a trial and error process, since the file is so small. Simply make changes, then refresh your browser to see the result.
- index.html has a few basic settings relevant to web display, most notably the title information that the browser will use
Within the css folder are .CSS files where you can make changes to many display attributes. This is typically where you will adjust fonts and font sizes, as well as some colors. The js folder has javascript files that can be edited to a certain degree, although caution is recommended if you’re not a javascript guru. Finally, the images folder contains any relevant image files to be used for web display, such as logos.
Alright, now that we have had a brief view of the technical details, let’s have a look at the network graph in the browser. Note that this is still a bit experimental at this stage; I’m attempting to customize each graph based on the official team colors or close variations in the color family.

To see some of the interactive functionality, let’s select a specific player. Simply type Ted Williams (the greatest Red Sox batter of all time) in the search box, and view the results:

Now we see only the direct connections (a 1st degree ego network) for Ted Williams (270 degrees in this case), as well as a wealth of statistical information previously calculated in Gephi, seen in the right panel. At the bottom of the panel are hyperlinks where any one of the 270 connections may be clicked, allowing us to view their network. As you can see, sigma.js quickly provides great interactivity for graph viewers.
Even better, we can scroll in to the network at any time:

Hovering on a node generates a pop-up title for that node, as seen for Ted Williams in this instance. We also begin to see the names of other prominent players at this zoom level. Additional zooming will reveal more player titles – a great way to embed information without making the original graph visually chaotic by displaying all titles at every level.
For the current web version of this graph, click here. I’ll try to keep this version active, even if I make improvements to the final network. Once again, thanks for reading!
