Tag: Code

MLB Trade Networks Part 3: Edges Code

In our previous post I shared the SQL code I created to pull data for our upcoming set of trade networks based on WAR (Wins Above Replacement) numbers from the Neil Paine 538 MLB data set. The prior post dealt with creating nodes for a network graph; this post will share code for edge creation. In simple terms, a graph needs edges that connect related nodes; for our case we need to connect transaction (trade) nodes to the teams and players involved in each transaction.

Part of what makes this case interesting is my desire to show edge weights based on the future WAR value each team received. Showing edges with varying weights will quickly help users to identify the relative importance of a trade. Wider edges will indicate a trade that involved high future value for one or both teams. In seeing the individual players involved in a common trade we can pinpoint where the future value (or lack thereof) comes from. This will become much clearer when the graphs are posted; I’ll do one or more posts on how to use and interpret each graph.

For now let’s examine the code. Gephi requires users to identify Sourcenodes and Targetnodes whether the edges are Undirected(i.e.- it doesn’t matter which node leads to the other) or Directed. Our initial code is for transactions to teams:

SELECT CONCAT(tr.TransactionID, ‘-‘, tr.PrimaryDate) AS Source, t.franchID AS Target, CONCAT(‘The ‘, t.name, ‘ received ‘, ROUND(SUM(h.WAR162),1),
‘ wins in future WAR value’) AS Label,
IF(ROUND(SUM(h.WAR162),1) = tr.season and tr.Type = ‘T’ AND tr.Season >= 1901 and LENGTH(tr.TeamTo) = 3 AND LENGTH(tr.TeamFrom) = 3
AND tr.Season = t.yearID
GROUP BY tr.TransactionID, tr.PrimaryDate, t.franchID, t.name;

With this code we are linking every transaction to the teams receiving one or more players in a trade. Note that we are summing the WAR value to create an edge weight based on the total value received by each team. If four players were involved (two to each team) these edge weights will reflect the combined values of these players. Note that we are setting edge weight = 1.0 if the future WAR is less than 1 (some will actually be negative so we need a minimal edge to show). Here’s a sample of results:
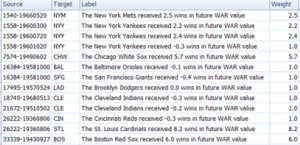
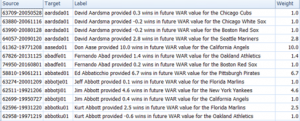
In contrast, the edges linking a transaction to individual players are based solely on that one player’s value. In the case cited above we will wind up with four lines of varying weights. Otherwise the code is quite similar:

SELECT CONCAT(tr.TransactionID, ‘-‘, tr.PrimaryDate) AS Source, p.playerID AS Target, CONCAT(p.nameFirst,’ ‘, p.nameLast, ‘ provided ‘, ROUND(SUM(h.WAR162),1),
‘ wins in future WAR value for the ‘, t.name) AS Label,
IF(ROUND(SUM(h.WAR162),1) = tr.season and tr.Type = ‘T’ AND tr.Season >= 1901 and LENGTH(tr.TeamTo) = 3 AND LENGTH(tr.TeamFrom) = 3
AND tr.Season = t.yearID AND t.franchID = h.franch_ID
GROUP BY tr.TransactionID, tr.PrimaryDate, p.nameFirst, p.nameLast, p.playerID, t.name;

The same logic on edge weights applies but now at the player level. Here are a few results:
I hope this makes sense – it will all become much more clear when the network graphs are produced. The good news is that I already have three graphs created and many more to come shortly. I’ll have some of them available on the site later this week. As always, thanks for reading.

Trade Network Updates, Part 2 (node code)

Over the last 10 days I’ve been playing around with code that will enable some new versions of the MLB trade networks I premiered way back in 2015. The goal this time around is to factor in the future value of a trade to each of the participating teams. There are multiple measures that could be used for this assessment but I’m going with the WAR162 value from Neil Paine’s 538 github data source. Here’s how the site describes the War162 measure: JEFFBAGWELL WAR per 162 team games. Now you may ask why Jeff Bagwell? While he was a talented hitter for many years, his name is used as an acronym for this:

“The file “jeffbagwell_war_historical.csv” contains wins above replacement (WAR) data — according to JEFFBAGWELL (the Joint Estimate Featuring FanGraphs and B-R Aggregated to Generate WAR, Equally Leveling Lists), which averages together WAR from Baseball-Reference.com and FanGraphs — plus various other metrics for MLB since 1901.” Fun stuff, right?

The bottom line from my perspective is that this measure provides a robust way of assessing the value of a trade based on performance after the trade date. Did one team benefit while another team received a player who added no future value? Or did both teams make out equally well? Or was the trade of minimal value for both sides? These are the questions I’m attempting to visually address using network analysis and visualization.

Now comes the technical aspect for all you database and code lovers. First step is to create the network nodes; in this case we need to display the individual trade transactions, teams, and players. Let’s look first at the transactions using the Visual-Baseball MySQL source data:

SELECT CONCAT(a.Id, ‘-‘, a.PrimaryDate) as Id, CONCAT(‘Transaction ‘,a.Id,’ is from the ‘, a.Season, ‘ season’) AS Label,
‘Trade’ AS Type, SUM(a.Size) AS Size
FROM
(SELECT tr.TransactionID AS Id, tr.Season, tr.PrimaryDate, ROUND(SUM(h.WAR162),1) as Size
FROM historical_WAR_and_more h
INNER JOIN People p
ON h.key_bbref = p.bbrefID
INNER JOIN trades2021 tr
ON p.retroID = tr.Player
INNER JOIN Teams t
ON tr.TeamTo = t.teamID

WHERE tr.Season >= 1901 and h.year_ID >= tr.season and tr.Type = ‘T’ and tr.TeamTo = t.teamID and LENGTH(tr.TeamFrom) = 3
AND tr.Season = t.yearID and t.franchID = h.franch_ID

GROUP BY tr.TransactionID, tr.season, tr.TeamFrom, tr.TeamTo, tr.PrimaryDate) a

GROUP BY a.Id, a.PrimaryDate, a.Season;

Here we are simply creating a node for each trade transaction, a label showing the teams involved and the trade date, and summing up the previously mentioned WAR162 to size the nodes. This will be an important part of the graph – trades that created large future values (for one or both teams) will be more prominent in the graph. Small value trades will be represented by very small nodes indicating their relative lack of importance. This one was a challenge, but finally got the code to deliver the expected results.

The next step is to create team nodes; in this case we’ll provide a constant size:

SELECT t.franchID AS Id, tf.franchName AS Label, 15 AS Size

FROM historical_WAR_and_more h
INNER JOIN People p
ON h.key_bbref = p.bbrefID
INNER JOIN trades2021 tr
ON p.retroID = tr.Player
INNER JOIN Teams t
ON tr.TeamFrom = t.teamID
INNER JOIN TeamsFranchises tf
ON t.franchID = tf.franchID

WHERE tr.season >= 1901 and h.year_ID >= tr.season and tr.Type = ‘T’ and h.team_ID = tr.TeamTo and LENGTH(tr.TeamFrom) = 3

GROUP BY t.franchID, tf.franchName;

By applying a constant node size of 15, each team will have a similar appearance in the graph which will not distract us from the trade values (some will be much larger than 15).

Our third and final node step is to provide information on all players involved in one or more trades:

SELECT Id, Label, ‘Player’ AS Type, 5 AS Size
FROM
(SELECT p.playerID AS Id,
CONCAT(h.player_name, ‘ (‘, p.birthYear,’-‘,p.deathYear,’)’,’ played from ‘,LEFT(p.debut,4),’ to ‘,LEFT(p.finalGame,4)) AS Label

FROM historical_WAR_and_more h
INNER JOIN People p
ON h.key_bbref = p.bbrefID
INNER JOIN trades2021 tr
ON p.retroID = tr.Player

WHERE tr.season >= 1901 and h.year_ID >= tr.season and tr.Type = ‘T’ and LENGTH(tr.TeamFrom) = 3
and LENGTH(tr.TeamTo) = 3
AND p.deathYear > 1900

GROUP BY h.player_name, p.playerID, p.birthYear, p.deathYear, p.debut, p.finalGame

UNION ALL

SELECT p.playerID AS Id,
CONCAT(h.player_name, ‘ (‘, p.birthYear,’-‘,’ )’,’ played from ‘,LEFT(p.debut,4),’ to ‘,LEFT(p.finalGame,4)) AS Label

FROM historical_WAR_and_more h
INNER JOIN People p
ON h.key_bbref = p.bbrefID
INNER JOIN trades2021 tr
ON p.retroID = tr.Player

WHERE tr.season >= 1901 and h.year_ID >= tr.season and tr.Type = ‘T’ and LENGTH(tr.TeamFrom) = 3
and LENGTH(tr.TeamTo) = 3
AND ISNULL(p.deathYear)

GROUP BY h.player_name, p.playerID, p.birthYear, p.deathYear, p.debut, p.finalGame) a
GROUP BY Id, Label;

Here we are running a UNION query so we can gather information about the players moving in each direction of a trade (from one team to another). We then combine that information and apply a fixed size of 5 since there are far more players than teams. We’ll have the ability in the finished networks to zoom in and see more about each player.

Each of these 3 outputs (trades, teams, and players) is combined into a single input file that will feed Gephi. We should wind up with between 10k and 20k nodes which we’ll be able to filter
and zoom on in the network graph. I have high hopes for this set of networks (there may be one for each team as well as a comprehensive one) as it should really help display the most important trades in MLB history.

That’s it for our node creation process; the next post will share how we create the edges that will connect trades to teams and teams to players. Thanks for reading!

Trade Network Updates, Part 1

A few years back (2016 o be specific) I created network graphs displaying the history of trades made for each MLB franchise, using transactions data from the wonderful Retrosheet project. These graphs presented more than a few challenges in how to present the data but I wound up with what I consider to be a very interesting set of results, which you can find here. I also created some posts on the process at that time, found here and here.

Here’s a snapshot within a graph:

Six seasons have elapsed since I created those graphs, so I thought it was beyond time to update them, but this time with a twist. Last fall I came across a great dataset that captures an array of advanced sabermetric statistics which I hope to use on a regular basis. These statistics can be used to assess a player’s true value relative to his peers each season. What if I could incorporate those into the trade network updates to show the post-trade value of each player to their new team? Ideally, this will help to show the value of each trade and which team wound up getting the better part of the deal.

Of course this would involve adding a degree of complexity to the MySQL code for pulling the data and shaping it for use in creating network graphs. However, the end result could be very revealing and worthwhile. Today I’m at the start of the process, tinkering with SQL code to extract the data in a proper format. Here’s an example:

SELECT h.player_name, p.playerID, tr.season, tr.TransactionID, tr.TeamFrom, tr.TeamTo, ROUND(SUM(h.WAR162),1) as WAR

FROM historical_WAR_and_more h
INNER JOIN People p
ON h.key_bbref = p.bbrefID
INNER JOIN trades2021 tr
ON p.retroID = tr.Player

WHERE tr.season >= 1901 and h.year_ID > tr.season and h.team_ID = tr.TeamTo AND tr.Type = ‘T’

GROUP BY h.player_name, p.playerID, tr.season, tr.TransactionID, tr.TeamFrom, tr.TeamTo

In this case, I’m looking at the cumulative WAR (Wins Above Replacement) for each traded player with their new team. This could be a single season total or the sum of many years in some cases. Here are some results:

We now have post-trade results (starting if the season following the trade) as measured by WAR for each traded player. We see one fairly substantial figure – the second Aaron Harang trade which netted 16.9 WAR points for his new team, the Cincinnati Reds (CIN in the results). Given that a single season WAR above 3 or 4 is considered substantial, it’s clear that his new team probably benefited from a few of those high-value seasons. What we can’t see yet is what they gave away in their half of the trade.

Fortunately, we can access this using the TransactionID field, which provides all the information for each party within the trade. But we’ll save that for another day as I figure out the next progression of the code. As always, thanks for reading!

Updating Baseball Team Networks – Part 1

A few years back, I used Gephi and sigma.js to create a series of interactive baseball team networks, one for each current MLB franchise. These networks displayed all players through the 2013 season, going all the way back to 1901 for the original American and National League franchises. Now that we have data through the 2017 season, it’s time for an update, not only from a data perspective, but also stylistically. This post will walk through the process of creating one of these networks using Toad for MySQL, Gephi, and sigma.js to create web-based interactive network visualizations.

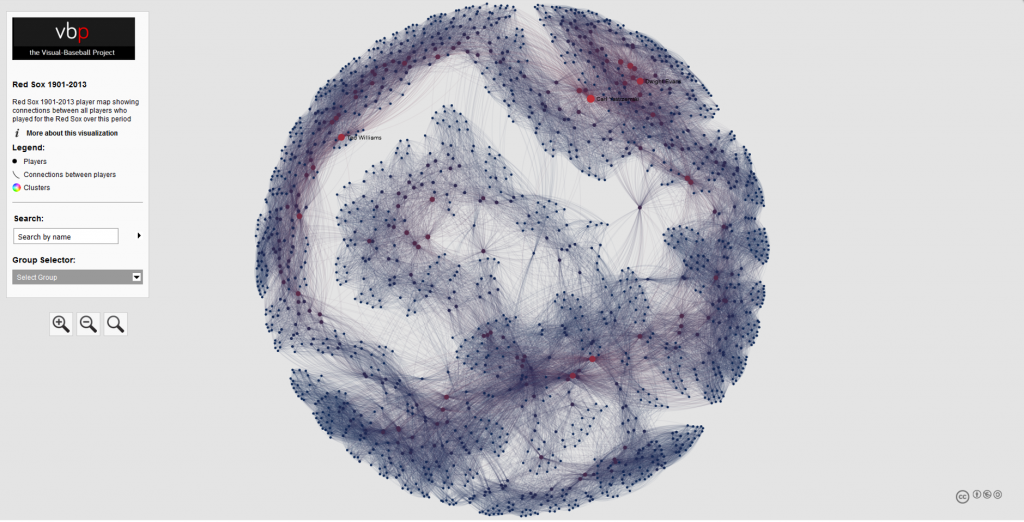
Here’s a typical network from the 2013 series; the full list of networks can be found here. We’ll use the existing networks as a baseline for the new networks, although a few modifications will be made.

baseball_team_network_2013
a 2013 baseball team network for the Boston Red Sox

Source Data & MySQL Queries

Let’s start our discussion with the source data. Season-level baseball data is available through the seanlahman.com website, in the form of .csv files or Microsoft Access database tables. I use the .csv format, as it can be easily added to existing MySQL databases on the visual-baseball.com server. MySQL also makes it simple to add derived fields through some simple coding. These fields can be utilized later for a variety of activities.

For the purpose of our network graphs, there are a handful of critical fields we want to use. These include the following:

  • playerID, a unique identifier for every player who ever donned a major league uniform
  • player name, which can be used to provide a meaningful reference based on the playerID field
  • yearID, which refers to the season (or seasons) a player suited up for a specific franchise
  • franchID, a unique identifier for each MLB franchise

We also need to do a little manipulation of the source data in our code to deliver our results in the proper form for use in Gephi. This means we need to create two input files – one for nodes, and a second for edges. The nodes will contain information about each player, the number of seasons played for the franchise and the first and last seasons, which may differ from the number of seasons, as players frequently leave a franchise only to return later in their career. Here’s our node code:

SELECT Id, Label, MAX(Size) as Size
FROM
(SELECT bp.playerID AS Id, CONCAT(bp.name, ” “, MIN(bp.yearID), “-“, MAX(bp.yearID)) AS Label, COUNT(bp.yearID) AS Size
FROM BattingPlus bp
WHERE bp.franchID = ‘BOS’ and bp.yearID >= 1901
GROUP BY bp.name

UNION ALL

SELECT pp.playerID AS Id, CONCAT(pp.name, ” “, MIN(pp.yearID), “-“, MAX(pp.yearID)) AS Label, COUNT(pp.yearID) AS Size
FROM BattingPlus pp
WHERE pp.franchID = ‘BOS’ and pp.yearID >= 1901
GROUP BY pp.name)  a
GROUP BY Id
ORDER BY Id;

Here’s the simple interpretation – since we are attempting to display all players for a given franchise, we are executing a UNION ALL statement to combine batters and pitchers into a single result file. We have used the playerID field to create the required Id value for Gephi, while also creating a Label field by combining the player’s name with their first and last years playing for this franchise. Finally, we have created a Size field based on the number of seasons played for the franchise. We can then choose to use this in Gephi to size each node, if we so choose.

We also need to create the edge file for Gephi. In this case, we want to understand how many seasons two players were on the same team. This code is a bit trickier, since we want to show only one connection between two players, since this will be an undirected graph. More on that distinction later. Here’s our edge code:

SELECT b.playerID AS Source, m.playerID  AS Target,  ‘Undirected’ as Type,  ‘ ‘ as Id, ‘ ‘ as Label, count(*) as weight
FROM
(SELECT a.playerID, CONCAT(m.nameFirst, ” “, m.nameLast) name, a.yearID, a.franchID

FROM Appearances a
INNER JOIN Master m
ON a.playerID = m.playerID

WHERE a.franchID = ‘BOS’ and a.yearID >= 1901) b

INNER JOIN Appearances a
ON b.yearID = a.yearID and b.franchID = a.franchID and b.playerID <> a.playerID and a.playerID > b.playerID
INNER JOIN Master m
ON a.playerID = m.playerID

GROUP BY b.playerID, a.playerID
ORDER BY b.playerID

Here we use the Master table to provide player name information, and we also gather the ID information to match the node values. The critical piece in this code is in our join criteria:

INNER JOIN Appearances a
ON b.yearID = a.yearID and b.franchID = a.franchID and b.playerID <> a.playerID and a.playerID > b.playerID

Here we are matching players based on the same season and the same franchise. We then specify that we do not want to connect any player to himself, and that we want only values where the playerID value from our main query is greater than the playerID value from the sub-query. This gives us a single connection between two players, which is what we need for an undirected graph. We then define a Source node (required by Gephi) and a Target node (also required), as well as specifying ‘Undirected’ as the graph type. We leave the ID and Label values empty, and then summarize the number of seasons played together as an edge weight. This value can be used in Gephi to show the strength of a connection between two nodes (e.g.- did they spend one season together, or 10 seasons together?).

After exporting each of these files to a .csv format, we have our source data for Gephi. In Part 2 our focus will shift to creating the network in Gephi.

Major League Baseball Trade Networks, Part 1

One topic that has long fascinated me as network graph material is trade data between major league baseball (MLB) teams. I have previously created a static visualization showing activity at a macro level, i.e.- the number of trades between teams over a 100+ year period. Yet there was a desire to do something more, and to make it interactive so users would be able to sift through the data for their favorite teams to understand trade patterns through a visual representation. Today, after weeks spent tinkering with this topic, I finally have something to share, and will walk through how it is created and how to engage with it online. If you want to play with it before reading further, visit the Tigers trade network.

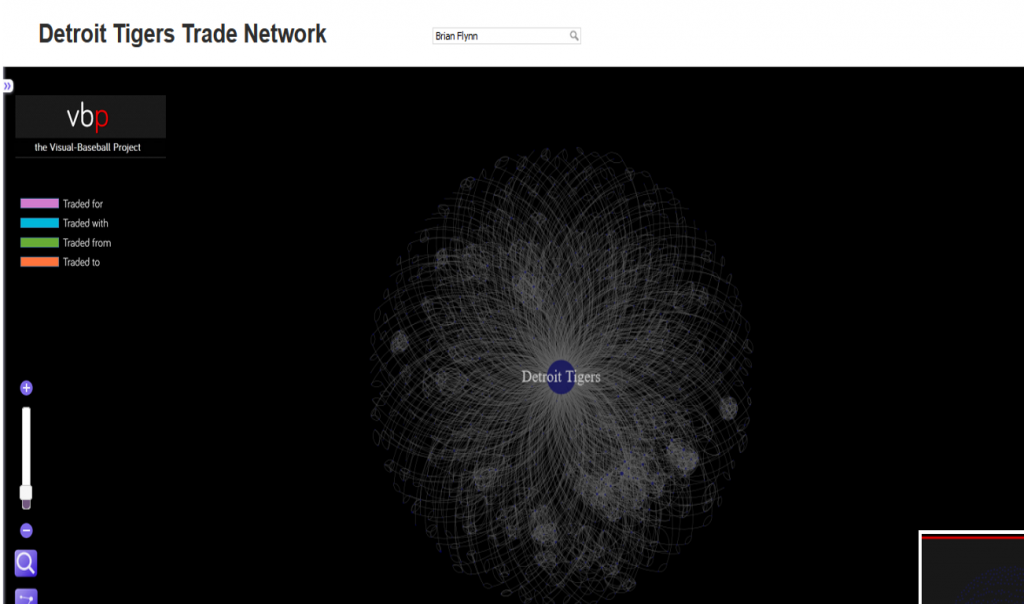
Here’s what we’ll wind up with:

Tigers trade network

My tools of choice in this endeavor are familiar ones to anyone working with baseball data, network graphs, or perhaps both, although I haven’t seen many instances of the latter. The trade data can be found at Retrosheet, as part of a seemingly boundless array of baseball data, both statistical and historical in nature. Gephi, the open source network analysis tool is again my choice for creating the network structure from the raw data, and Sigma.js is once more the tool for web implementation. Mix in a bit of Excel and PowerPoint for good measure, and we have all the tools necessary to create a pretty cool (IMHO) finished graph.

So let’s get started. Our first step is to go to the Retrosheeet site and download trade data, found at Retrosheet transactions. Be aware that there is much more than trade data in this dataset; free agent transactions, releases, and many other transaction types are available. My approach is to grab the entire dataset, which I can then load into a MySQL database for filtering and matching to other baseball data from both Retrosheet and the Lahman archives. For our example, only trades will be used; this leaves open the future possibility to examine free agent signings or other transaction types.

Once I have the data in MySQL (I’m purposely skipping over this process), the coding steps begin. This was a very iterative process as I gradually figured out how Gephi would play with the output data, but I won’t bore you with my multiple missteps. Instead, let’s have a look at the code snippets, and I’ll explain their usage and the thought process behind them. We’ll start with a view of the code, created within the (free) Toad for MySQL tool. In creating this code, we need to understand how Gephi (or other network analysis tools) work. At the risk of over-simplifying, Gephi only needs nodes and edges. Nodes will represent the players or teams in our visual, while edges will show the linkages within a single trade – who was traded for whom, and which players moved together from one organization to another.

Node creation is simple – we just grab all players involved in a trade, and do likewise for all teams. Here’s the code for players:

SELECT t.Player as Player, CONCAT(m.nameFirst, ” “, m.nameLast) as Name, count(*) as transactions

FROM trades2015 t
INNER JOIN Master m
ON t.Player = m.retroID

WHERE t.Type = ‘T’ and (t.TeamFrom > ‘A’ OR t.TeamTo > ‘A’)
GROUP BY t.Player, CONCAT(m.nameFirst, ” “, m.nameLast)

All we’re doing here is creating a node size for each player, based on the number of trades they are involved in.

For Teams, the logic is a bit more complex; since team names have changed from season to season, we need to join on both team and season to get the correct name assignments. We also want to account for the direction of each transaction, which we do using a UNION query.

SELECT b.Team AS Id, b.Name As Label, SUM(b.transactions) as Size
FROM
(SELECT t.TeamFrom as Team, te.name as Name, count(*) as transactions

FROM trades2015 t
INNER JOIN Teams te
ON te.teamID = t.TeamFrom and t.Season = te.yearID

WHERE t.Type = ‘T’ and t.TeamFrom > ‘A’
GROUP BY t.TeamFrom, te.name

UNION ALL

SELECT t.TeamTo as Team, te.name as Name, count(*) as transactions

FROM trades2015 t
INNER JOIN Teams te
ON te.teamID = t.TeamTo and t.Season = te.yearID

WHERE t.Type = ‘T’ and t.TeamFrom > ‘A’
GROUP BY t.TeamTo, te.name) b
GROUP BY b.Team, b.Name

After running the queries, we have results that can be posted into Excel or other spreadsheet software, where a tab-delimited file can be saved for use in Gephi. Our file data looks like this:

Id Label Size
aardd001 David Aardsma 4
aaroh101 Hank Aaron 1
aased001 Don Aase 1
abadf001 Fernando Abad 1
abbae101 Ed Abbaticchio 1
abbeb101 Bert Abbey 1
abbof101 Fred Abbott 1
abboj001 Jim Abbott 2

and for the team entries:


OAK Oakland Athletics 936
PH4 Philadelphia Athletics 6
PHA Philadelphia Athletics 355
PHI Philadelphia Blue Jays 28
PHI Philadelphia Phillies 1445
PHI Philadelphia Quakers 3
PIT Pittsburg Alleghenys 9
PIT Pittsburgh Pirates 1416

This is all Gephi requires for displaying nodes – an ID, a Label, and size. Even the label and size are not required fields, but they do make things easier if done in advance. So far, so good. Next we’ll move on to the somewhat more involved process of creating edge files.

As I progressed deeper into this project, it became evident to me that there were four different types of edges to display. The first two were obvious and easy – players being traded to a team, or from a team. Yet I also wanted to see the other players involved in each transaction, which necessitated the addition of two more edge type – traded with other players, and traded for other players. Note that in many cases just two or three of these might come into play, and for many prominent players, we’ll have none at all. Thus, the likes of an Al Kaline or Ted Williams will not be found in any of these graphs, as they remained with a single team for their entire careers.

Here’s the final edge code I wound up with to create the four categories of trades to be displayed in a graph. Gephi requires three edge attributes – a source value, a target value, and an edge type. The edge type must be either undirected or directed; for our graph, all edges will be directed, since we intend to show the bi-directional movements within each transaction. The first bit of code is for instances where a player was traded from a team:

SELECT tr.Season, tr.TransactionID, tr.PrimaryDate, tr.TeamFrom AS Source, tr.Player as Target,
CASE WHEN tr.Type = ‘T’ THEN ‘Trade’ WHEN tr.Type = ‘F’ THEN ‘Free Agent Signing’ WHEN tr.Type = ‘Fg’
THEN ‘Free Agent Granted’ WHEN tr.Type = ‘R’ THEN ‘Release’ END as Category,
CONCAT(m.nameFirst, ” “, m.nameLast, ” “, CASE WHEN tr.Type = ‘T’ THEN ‘Traded’ WHEN tr.Type = ‘F’ THEN ‘Free Agent Signing’ WHEN tr.Type = ‘Fg’
THEN ‘Free Agent Granted’ WHEN tr.Type = ‘R’ THEN ‘Released’ END, ” on “, tr.PrimaryDate, ” from “, t.name) AS Label, ‘Directed’ as Type, ‘Traded From’ as CategoryDetail

FROM trades2015 tr
INNER JOIN Master m ON tr.player = m.retroID
INNER JOIN Teams t ON tr.TeamFrom = t.teamIDretro and t.yearID = tr.season

WHERE tr.type = ‘T’

Note the legacy code covering free agency and releases, rendered moot by the WHERE clause. These will have to wait for another set of graphs. In a similar fashion we have code for trades where a player comes to a team.

SELECT tr.Season, tr.TransactionID, tr.PrimaryDate, tr.Player AS Source, tr.TeamTo as Target,
CASE WHEN tr.Type = ‘T’ THEN ‘Trade’ WHEN tr.Type = ‘F’ THEN ‘Free Agent Signing’ WHEN tr.Type = ‘Fg’
THEN ‘Free Agent Granted’ WHEN tr.Type = ‘R’ THEN ‘Release’ END as Category,
CONCAT(m.nameFirst, ” “, m.nameLast, ” “, CASE WHEN tr.Type = ‘T’ THEN ‘Traded’ WHEN tr.Type = ‘F’ THEN ‘Free Agent Signing’ WHEN tr.Type = ‘Fg’
THEN ‘Free Agent Granted’ WHEN tr.Type = ‘R’ THEN ‘Released’ END, ” on “, tr.PrimaryDate, ” to “, t.name) AS Label, ‘Directed’ as Type, ‘Traded To’ as CategoryDetail

FROM trades2015 tr
INNER JOIN Master m ON tr.player = m.retroID
INNER JOIN Teams t ON tr.TeamTo = t.teamIDretro and t.yearID = tr.season

WHERE tr.type = ‘T’

Next, it’s time to create linkages with players from the same transaction, first those moving in the same direction (traded with) in the trade.

SELECT tr.Season, tr.TransactionID, tr.PrimaryDate, tr.Player AS Source, tr2.Player AS Target,
CASE WHEN tr.Type = ‘T’ THEN ‘Trade’ WHEN tr.Type = ‘F’ THEN ‘Free Agent Signing’ WHEN tr.Type = ‘Fg’
THEN ‘Free Agent Granted’ WHEN tr.Type = ‘R’ THEN ‘Release’ END as Category,
CONCAT(m.nameFirst, ” “, m.nameLast, ” “, CASE WHEN tr.Type = ‘T’ THEN ‘Traded’ WHEN tr.Type = ‘F’ THEN ‘Free Agent Signing’ WHEN tr.Type = ‘Fg’
THEN ‘Free Agent Granted’ WHEN tr.Type = ‘R’ THEN ‘Released’ END, ” on “, tr.PrimaryDate, ” with “, m2.nameFirst, ” “, m2.nameLast) AS Label, ‘Directed’ as Type,
‘Traded With’ as CategoryDetail

FROM trades2015 tr
INNER JOIN trades2015 tr2
ON tr.TransactionID = tr2.TransactionID
INNER JOIN Master m ON tr.player = m.retroID
INNER JOIN Master m2 ON tr2.player = m2.retroID

WHERE tr.type = ‘T’

Note the need to duplicate the Master table in the code, since we now require multiple player names to populate the Source and Target fields in Gephi. The same holds true for our last snippet, where players are traded for one another.

SELECT tr.Season, tr.TransactionID, tr.PrimaryDate, tr.Player AS Source, tr2.Player AS Target,
CASE WHEN tr.Type = ‘T’ THEN ‘Trade’ WHEN tr.Type = ‘F’ THEN ‘Free Agent Signing’ WHEN tr.Type = ‘Fg’
THEN ‘Free Agent Granted’ WHEN tr.Type = ‘R’ THEN ‘Release’ END as Category,
CONCAT(m.nameFirst, ” “, m.nameLast, ” “,CASE WHEN tr.Type = ‘T’ THEN ‘Traded’ WHEN tr.Type = ‘F’ THEN ‘Free Agent Signing’ WHEN tr.Type = ‘Fg’
THEN ‘Free Agent Granted’ WHEN tr.Type = ‘R’ THEN ‘Released’ END, ” on “, tr.PrimaryDate, ” for “, m2.nameFirst, ” “, m2.nameLast) AS Label, ‘Directed’ as Type,
‘Traded For’ as CategoryDetail

FROM trades2015 tr
INNER JOIN trades2015 tr2
ON tr.TransactionID = tr2.TransactionID
INNER JOIN Master m ON tr.player = m.retroID
INNER JOIN Master m2 ON tr2.player = m2.retroID

WHERE tr.type = ‘T’

Each of these bits of code outputs results, which are then copied and pasted into our edges spreadsheet. Here are five rows showing each of our four trade categories:

Season TransactionID PrimaryDate Source Target Category Label Type CategoryDetail
2010 62908 20100731 KCA ankir001 Trade Rick Ankiel Traded on 20100731 from Kansas City Royals Directed Traded From
2010 60709 20100831 TEX ariaj001 Trade Joaquin Arias Traded on 20100831 from Texas Rangers Directed Traded From
2010 62264 20101118 COL barmc001 Trade Clint Barmes Traded on 20101118 from Colorado Rockies Directed Traded From
2010 72627 20101217 TBA bartj001 Trade Jason Bartlett Traded on 20101217 from Tampa Bay Rays Directed Traded From
2010 72622 20100709 TEX beavb001 Trade Blake Beavan Traded on 20100709 from Texas Rangers Directed Traded From

2010 62908 20100731 ankir001 ATL Trade Rick Ankiel Traded on 20100731 to Atlanta Braves Directed Traded To
2010 60709 20100831 ariaj001 NYN Trade Joaquin Arias Traded on 20100831 to New York Mets Directed Traded To
2010 62264 20101118 barmc001 HOU Trade Clint Barmes Traded on 20101118 to Houston Astros Directed Traded To
2010 72627 20101217 bartj001 SDN Trade Jason Bartlett Traded on 20101217 to San Diego Padres Directed Traded To
2010 72622 20100709 beavb001 SEA Trade Blake Beavan Traded on 20100709 to Seattle Mariners Directed Traded To

2010 62908 20100731 ankir001 blang001 Trade Rick Ankiel Traded on 20100731 for Gregor Blanco Directed Traded For
2010 62908 20100731 ankir001 chavj001 Trade Rick Ankiel Traded on 20100731 for Jesse Chavez Directed Traded For
2010 62908 20100731 ankir001 collt001 Trade Rick Ankiel Traded on 20100731 for Tim Collins Directed Traded For
2010 60709 20100831 ariaj001 franj004 Trade Joaquin Arias Traded on 20100831 for Jeff Francoeur Directed Traded For
2010 72627 20101217 bartj001 figuc001 Trade Jason Bartlett Traded on 20101217 for Cole Figueroa Directed Traded For

2010 62908 20100731 ankir001 farnk001 Trade Rick Ankiel Traded on 20100731 with Kyle Farnsworth Directed Traded With
2010 66840 20101219 betay001 greiz001 Trade Yuniesky Betancourt Traded on 20101219 with Zack Greinke Directed Traded With
2010 72622 20100709 beavb001 luekj001 Trade Blake Beavan Traded on 20100709 with Josh Lueke Directed Traded With
2010 72622 20100709 beavb001 smoaj001 Trade Blake Beavan Traded on 20100709 with Justin Smoak Directed Traded With
2010 62908 20100731 blang001 chavj001 Trade Gregor Blanco Traded on 20100731 with Jesse Chavez Directed Traded With

We have now successfully prepared the data for Gephi. In our next post, I’ll examine the process starting with the Gephi data import phase. Thanks for reading!